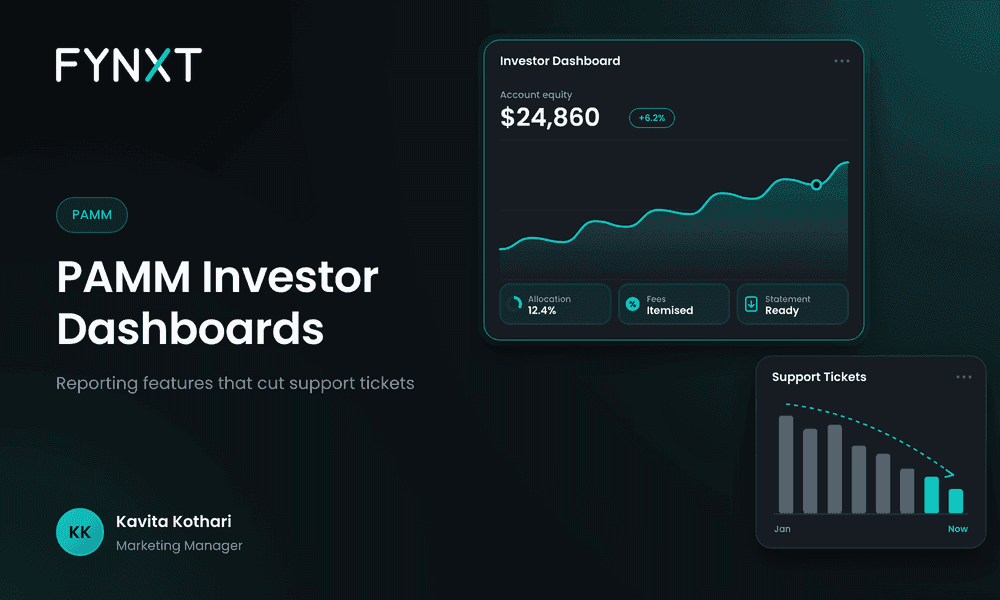

A PAMM investor dashboard cuts support tickets by answering, without a human, the 10 questions investors ask repeatedly: fees charged, allocation share, withdrawal status, equity, drawdown, statements, and manager performance. In the illustrative audit below, 355 of 540 tickets over 90 days are answerable by a dashboard field.
Short Answer
- Investors raise the same 10 questions. Each one maps to a specific field, and a field that is missing becomes a ticket.
- Fee questions are the largest category, because an investor who cannot see fees separated from gross profit assumes the worse of the two.
- Status questions are fully deflectable by a field. Explanation questions, such as why a fee was charged, need a field plus one line of context.
- Two categories are not deflectable at all and should go to a human: manager comparison and margin alerts.
- FYNXT PAMM issues an automated daily statement at 23:59:59 in the MT4/MT5 statement format, plus monthly statements and quarterly performance reports.
- Audit your own ticket log against the 10 categories before buying a dashboard. The method is in this article and it takes an afternoon.
Why Do PAMM Investors Raise So Many Tickets?
PAMM investors raise tickets because they are read-only participants in somebody else's trading account. They cannot open the terminal and check. Every question about their own money has to be answered either by a screen you built or by a person you pay.
That is a structural difference from a self-directed trading client, and it is why dashboard scope is an operating-cost decision rather than a product-marketing one. The vendor pages currently cited on this topic do not treat it that way. Brokeree's PAMM Admin Portal page is thorough on broker-side administration and names investor records only as items your team reviews, with no investor-facing dashboard described. FxCoreCRM's PAMM page refers to dual dashboards for managers and investors without listing what either one displays.
So the field-level question stays unanswered. Below is the list.
The 10 Reporting Metrics PAMM Investors Ask About Most
Each row names the metric, the question behind it, and the ticket it prevents. The last column is the honest part: whether FYNXT documents the field, or whether it is a requirement you should put to any vendor.
PAMM Investor Query Deflection Matrix
| # | Metric or field | Why investors ask | Ticket it prevents | Documented in FYNXT PAMM? |
| 1 | Fee breakdown by type, shown separately from gross profit | They see a net figure and cannot tell performance fee from management fee from volume fee | "What is this deduction?" Fee disputes escalating to a manager complaint | Yes. Transparent fee calculation with automated settlement, across six fee types |
| 2 | Allocation share and method | Their share differs from another investor who deposited the same amount | "Why is my position smaller than my colleague's?" | Yes. Four allocation methods, selected per strategy, allocated to 5 decimal places |
| 3 | Withdrawal and partial-withdrawal status | Money has left their equity but not arrived | "Where is my withdrawal?" Repeat chasing every 24 hours | Yes. Partial withdrawal available at any time, with fees pro-rated and settled on exit |
| 4 | Current equity against amount deposited | They want one number: am I up or down | "How much do I actually have?" | Yes. Full equity and virtual position view, read-only on the master account |
| 5 | Drawdown from peak | They are down and want to know whether this is normal for the strategy | "Should I be worried?" Panic unsubscribes at the worst moment | Requirement, not a documented field. Put it to the vendor. See Appendix D |
| 6 | Daily statement, retrievable by the investor | They need a record for their own files or their accountant | "Can you email me last month's statement?" Repeated manual sends | Yes. Automated daily statement at 23:59:59 in the MT4/MT5 statement format |
| 7 | Monthly statement and quarterly performance report | They want a periodic summary of earnings and payables | "What did I earn last quarter?" | Yes. Monthly account statements plus detailed quarterly performance reports |
| 8 | Top-up reflected in allocation | They deposited and want to see it counted | "My deposit is not showing" | Yes. Top-up at any time, reflected in the investor record |
| 9 | Manager performance and strategy stats before subscribing | They are choosing between strategies | "Which manager should I pick?" Which your team must not answer | Yes for the data. Performance stats and trade lists are viewable and configurable, and strategies are published to a leaderboard widget |
| 10 | Margin alert and stop-out thresholds | An alert fired and they do not know what it means | "What does this warning mean?" | Yes. Margin call alert at 30% free margin and auto stop-out at 20%, both configurable per strategy |
Note what row 9 does. The dashboard supplies the performance data, but your support team must never recommend a strategy, because that is investment advice. A leaderboard and visible strategy stats move that question off your team without creating a suitability problem.
Which Questions a Field Actually Deflects, and Which It Does Not
Not every ticket disappears when you add a field. Status questions do, because the answer is a value. Explanation questions only half disappear, because the investor can now see the number but still wants to know why it is that number.
| Deflection type | Categories | What the dashboard has to carry |
| Fully deflectable | Withdrawal status, equity vs deposited, statement retrieval, top-up reflected | A value and a timestamp. Nothing else needed. |
| Partially deflectable | Fee breakdown, allocation share and method, drawdown from peak | The value plus one line of plain-language context, or a link to the strategy terms. The number alone generates a follow-up. |
| Not deflectable | Manager performance comparison, margin alert meaning | A human, or a disclosure document. Do not try to automate advice. |
That three-way split is the design brief. Spend your build or configuration effort on the middle row, because that is where a field without context simply converts one ticket into a different ticket.
How to Audit Your Own Support Tickets in One Afternoon
Audit your ticket log before you evaluate a dashboard, so you are buying against your own numbers rather than a vendor feature list. The method takes four steps.
- Export 90 days of tickets from managed-account investors only. Exclude self-directed trading clients, because their question mix is different.
- Tag each ticket to one of the 10 categories above. Anything that does not fit is an eleventh category worth knowing about.
- Mark each category fully, partially or not deflectable using the table above.
- Add fully deflectable plus half of partially deflectable. That total is your realistic deflection ceiling, and it is the number to put in front of whoever approves the spend.
Illustrative worked example. These counts are invented for illustration and are not FYNXT data, client data or an industry benchmark. Replace every figure with your own export.
Illustrative 90-day ticket audit, 600 investors
| Category | Tickets in 90 days | Deflection type |
| Fees charged and why | 150 | Partial |
| Allocation and why my share differs | 85 | Partial |
| Withdrawal status | 80 | Full |
| Equity vs amount deposited | 70 | Full |
| Drawdown, why am I down | 55 | Partial |
| Statement not received or cannot find | 40 | Full |
| Manager performance comparison | 30 | None |
| Top-up not reflected | 20 | Full |
| Margin alert meaning | 10 | None |
| Total | 540 | 210 full, 290 partial, 40 none |
On those illustrative inputs, 540 tickets across 600 investors over 90 days is 0.3 tickets per investor per month. Fully deflectable is 210. Half of partially deflectable is 145. The deflection ceiling is 355 of 540, or roughly 66%, leaving 185 tickets that genuinely need a person.
Run this and the dashboard conversation changes shape. You stop asking which vendor has more reporting features and start asking which one carries the four fields behind your largest categories.
Common Mistakes in PAMM Investor Reporting
- Showing net profit without the fee breakdown. This is the single largest ticket generator, and the fix is a column rather than a feature.
- Publishing a number with no definition. Drawdown measured from peak equity and drawdown measured from deposit are different figures, and an undefined one creates the ticket it was meant to prevent.
- Making statements request-only. If an investor has to ask for a statement, your team sends statements manually forever.
- Letting support answer "which manager should I pick?" Give investors strategy data and a leaderboard, and keep your team out of advice.
- Hiding withdrawal status. An investor who cannot see a pending withdrawal will ask daily until it lands.
- Reporting allocation without naming the method. The share makes no sense unless the investor knows whether it was computed on balance, equity, a set percentage or a fixed lot.
- Treating the dashboard as an investor-experience project. It is an operating-cost project with an investor-experience benefit, and it gets approved faster when presented that way.
Summary
Investor reporting is a support-cost lever disguised as a feature list. The 10 metrics above account for the questions your team answers over and over, and roughly two-thirds of them can be answered by a field with a timestamp and, where the question is an explanation rather than a status, one line of context. Audit 90 days of your own tickets against those categories first. The result tells you which fields to insist on, and it is a stronger case for the spend than any vendor comparison table.
Frequently Asked Questions
Ten things: fee breakdown by type, allocation share and method, withdrawal status, current equity against deposits, drawdown from peak, retrievable daily statements, periodic performance reports, top-up confirmation, strategy and manager performance data, and margin alert thresholds. FYNXT PAMM documents nine of the ten; drawdown from peak should be confirmed with any vendor, including FYNXT.